| Sankey Flow Show | Attractive flow diagrams made in minutes |
- APP
- INFO
- PRICING
- ACCESSORIES
- ABOUT
Online help: Diagram data
Perspectives and logic | |
|---|---|
| Item data, connection data, diagram data | |
| Sankey Flow Show diagrams are consisting of a design layer and a data layer. This help section explains the data layer and the different perspectives (item, connection, diagram) to look at the data layer. | |
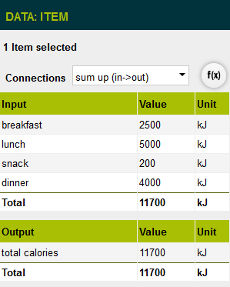
An item has inputs and outputs. In the data form of an item you can see additional rows for the summed up total values. Please note, that you can enter values followed by a unit and you can enter the unit in the separate column which is sightly different. Item data follows different logic types:
|
 |
| When you select a connection, you see the same data (see item data) from another angle: A connection has producers and consumers (items). The logic behind a connection is fix: The sum of producer values equals the sum of consumer values. | 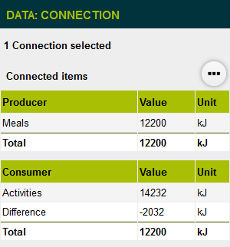 |
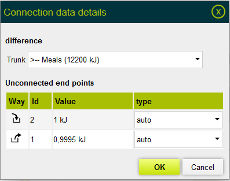
The dialog for connection data details pops up when you click at the "..."-button in the connection data form. The dialog has 2 purposes:
What happens, when I change a value?
|
 |
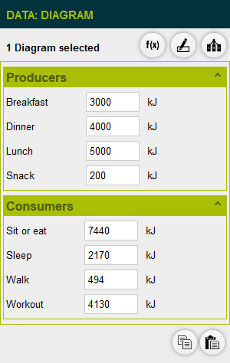
| When you click at the (white) diagram surface to select the diagram itself, the data form shows the same data (see above) from a third angle. If you didn't change an item logic to "user input", there will be just a text message. | |
If one or more items of the diagram are classified as "user input", then the diagrams data form provides a structured view on the input and output values of these items. Depending on your license, you can customize the diagrams data form. (see below) |
 |
Parameters | |
|---|---|
| Mathematical formulas, etc. | |
The parameter dialog can be opened with the "f(x)"-buttons in the item data form and the diagram data form. You can add parameters to an item and you can add parameters to the diagram itself. |
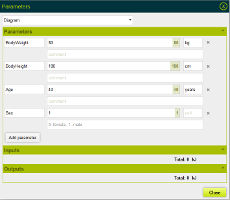 |
A parameter has a name starting with an alphabetic character or an underscore and contains no white space or special character (+-*/...) The second parameter field can contain a numeric value or a mathematical formula (see below). The "unit" field of a parameter is optional. In case you plan to show the parameter in a customized diagram data form, you should give it a reasonable value. The "comment" is also an optional field. You can e.g. explain the mathematical formula or give a hint to the parameters purpose. | |
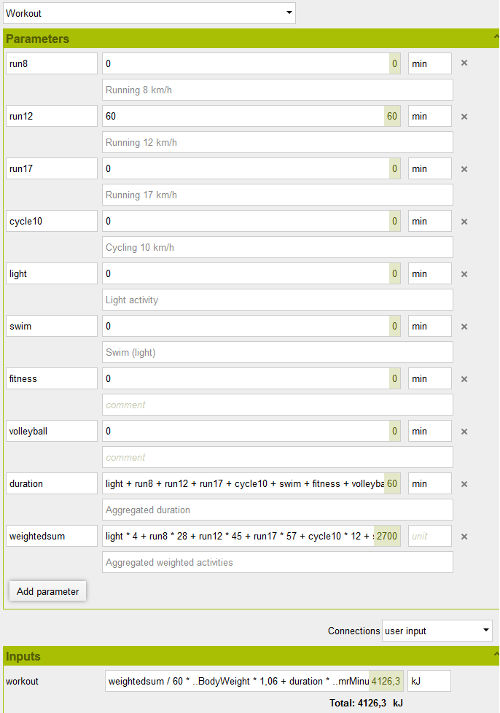 | |
| Not only the parameters can utilize mathematical functions but also input and output values can make use of them and parameters can be referenced. | |
| Mathematical formulas Following operators and functions can be utilized in mathematical formulas: Operators: +, -, *, /, ^ Logical operators: <, <=, =, >=, >, #, and, or Functions: if, sin, cos, tan, asin, acos, atan, rad, deg, ceil, floor, abs, exp, int, round, sqrt, sqr, max, min, log |
ATTENTION: The functions "min", "max" and "if" accept multiple arguments. Make sure that you apply the list separator specific to your country settings. E.g. US: "," (comma), Germany: ";" (semicolon) The "if" function has following pattern: if (condition, valueIfTrue, valueIfFalse) The "condition" is a logical expression (e.g. "a > b", "(c > 5) and (c <= 10)"), the other values are numeric or formulas. If the condition is true, the "if"-function results in its second argument, if the condition is false, it results in the third argument. |
References to parameters Parameters are associated to a "scope": an item or to the diagram itself. We can distinguish three different cases of parameter references:
|
Examples of references in mathematical formulas
|
Customized data form | |
|---|---|
| "Edit form" dialog | |
| There are many reasons to customize the data form of a diagram. In the picture on the right, you see the example data form from our tutorial. | 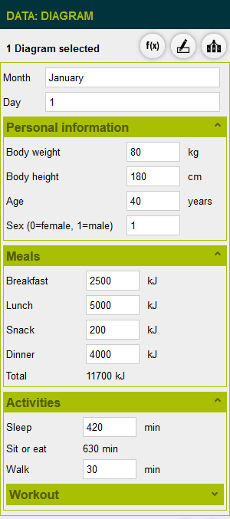 |
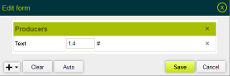
To open the dialog to edit a data form, click at the (white) diagram surface to select it and below "Data" click at the second button "Edit form". The "Edit form" dialog shows an extended view of the data form. You can drag lines and groups to another position. Click at a line to change the text or the referenced value. |
 |
| Initially, the data form is generated automatically with a simple structure. As long as you don't change the form, Sankey Flow Show does adjust it to diagram changes (e.g. new item with logic "user input"). Once you change the data form (and press save), the form remains as you defined it. (Exception: Data values, which are deleted in the diagram will automatically be removed from your data form.) | 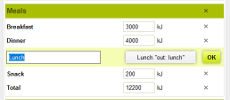 |
| Data forms can contain elements of following types: | |
Value input Input field to change a data value. Just numeric values can be referenced. Each data value can be referenced just once in a data form. |
Examples:
|
Value display Output field to display a data value. All data values (numeric, formulas and "auto adjusted") can be referenced multiple times in a data form. |
Examples:
|
Text Text field for additional explanations or comments. |
Example:
|
Group Structural element which can be collapsed to a single title line. Groups can be nested. |
Examples:
|
Attribute Textual input field for diagram attributes. Attribute values can be shown in diagram titles and item captions. (Please see the advanced tutorial) |
Examples:
|
Scenarios | |
|---|---|
| Apply different value sets | |
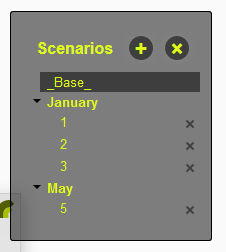
To open the "scenario" dialog, click at the (white) diagram surface to select it and below "Data" click at the third button "Scenarios". Depending on the attributes of the diagrams data form, there are folders to structure the scenario list. (Please see the advanced tutorial for a detailed explanation.) Hint: In our tutorial, we decided that our diagram should hold just scenarios of a single year. Therefore, we added the attributes "Month" and "Day" (and not "Year"). For the next year, we planned to create a copy of the total diagram including the scenarios. |
 |