Tutorial: Intelligent diagram design (advanced)

Required license: Pro
The complete example: My calories
Understand the goal of this tutorial.
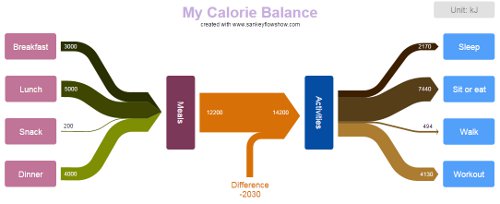
In this tutorial we start with the outcome of intermediate tutorial (see picture below).

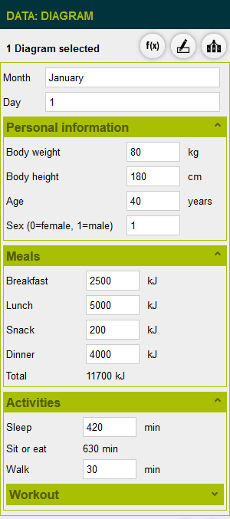
Our first goal is to customize the form for value changes. At the end it should look like the one shown in the picture on the right. This form has some additional fields. For instance, there are input fields for "body weight" and "activity duration" instead of the fields for burned calories.

In order to achieve this first goal, we need some additional parameters and mathematical formulas. So, we have the subgoal to extend the data layer of our diagram with the additional mathematical information (see "Given data" below).

It is not necessary to understand each mathematical detail of the given formulas. In case, that you are interested in the topic please find "basal metabolic rate" on Wikipedia®.

We use the shorts "bmr" for "basal metabolic rate" and "mrMinute" for "metabolic rate per minute".

Given data

Diagram

BodyWeight80 kg
BodyHeight180 cm
Age40 years
Sex1
bmrMale275.3 * (BodyWeight ^ 0.75) * (1 + 0.004 * (30 - Age) + 0.018 * (BodyHeight / (BodyWeight ^ 0.33333) - 42.1))
bmrFemale297.9 * (BodyWeight ^ 0.75) * (1 + 0.004 * (30 - Age) + 0.01 * (BodyHeight / (BodyWeight ^ 0.33333) - 43.4))
mrMinuteif(Sex = 1, bmrMale, bmrFemale) * 1.06 / 1440

Sleep

duration420 min
sleepduration * ..mrMinute

Walk

duration30 min
walkduration * (8 / 60 * ..BodyWeight * 1.06 + ..mrMinute)

Sit or eat

duration1440 - ..Sleep.duration - ..Walk.duration - ..Workout.duration
sit or eatduration * (2 / 60 * ..BodyWeight * 1.06 + ..mrMinute)

Workout

run80 min
run1290 min
run170 min
cycle100 min
light0 min
swim0 min
fitness0 min
volleyball0 min
durationlight + run8 + run12 + run17 + cycle10 + swim + fitness + volleyball
weightedsumlight * 4 + run8 * 28 + run12 * 45 + run17 * 57 + cycle10 * 12 + swim * 25 + fitness * 30 + volleyball * 36
workoutweightedsum / 60 * ..BodyWeight * 1.06 + duration * ..mrMinute
ATTENTION: If you copy'n'paste the formulas from this example, please make sure, that you use the correct number format for your localization (e.g. for German user interface, replace the decimal separator with a comma "," and the list separator in the "if"-formula with a semicolon ";")
The second goal of this tutorial is, to create several scenarios (e.g. "January 1", "January 2", "January 3", etc.) and to apply particular value sets for each of these scenarios.
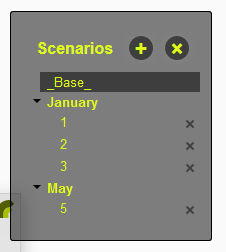
We recommend to initially use our example values, so that you can compare your results with the results in this example. After you finished this tutorial, you can enter your personal values in the customized user form of the complete diagram.
Add logic to your diagram
Parameters and mathematical formulas

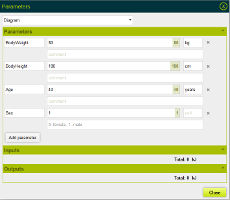
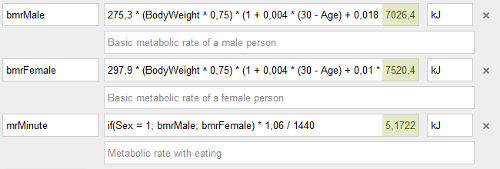
You can add parameters to each item of your diagram as well as to the diagram itself.

We start with the parameters of the diagram itself:

  1. Click at the white diagram surface to select it
  2. Below "Data" click at the "Parameters" button (leftmost button)
  3. In the "Parameters" dialog click "Add parameter"
  4. Enter "BodyWeight" as name, "80" as value and "cm" as unit
  5. Click "OK"
  6. Add the parameters "BodyHeight", "Age" and "Sex" as specified below "Given data"
Now, let's add a formula:
  1. Add a parameter "bmrMale"
  2. Start typing "b" (a dropdown will appear)
  3. Use the arrow keys <up> and <down> to select "BodyWeight"
  4. Hit the <return>-key to accept the current selection
Sankey Flow Show helps you in this way to enter mathematical formulas. When a formula field is unfocused, the calculated value appears at the right. You can test this e.g. with "BodyWeight * 2"

Complete the diagram parameters

  1. Add the parameters "bmrMale", "bmrFemale", "mrMinute"
  2. Enter the formulas from "Given data" (ATTENTION: Make sure you replaced the decimal separators and list separators with your localization.)
  3. If you like, add comments as shown in the picture below.
  4. Check the shown values and compare them with the picture below.
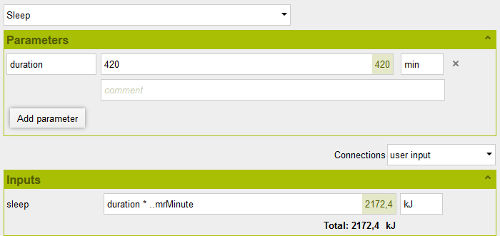
We continue with the item "Sleep"
  1. Close the parameter dialog
  2. Select the item "Sleep" with a click
  3. Below "Data" click at the "parameters" button
  4. Add a parameter "duration" with value "420" and unit "min"

Next, we want to refer the parameter from the input of the item "Sleep"

  1. Enter the formula "duration * ..mrMinute" in the value field of "sleep"
In this formula, we referenced the parameter "duration" of the item "Sleep" and the parameter "mrMinute" of the diagram. Please note, that the two dots ".." before "mrMinute" mean "one level up". So, when we enter a formula for the item "Sleep", then "one level up" references the diagram itself and in our case its parameter "mrMinute".
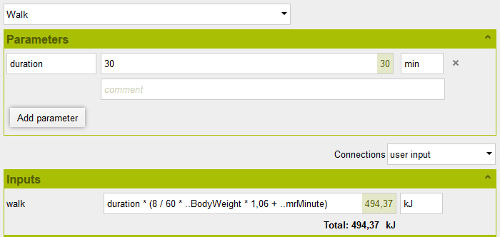
We skip "Sit or eat" for the moment and continue with "Walk"
  1. Close the parameter dialog and open it again for the item "Walk"
  2. Add a parameter "duration" with value "30" and unit "min"
  3. Enter the formula from "Given data" for the input "Walk"
  4. Compare the value with the picture below
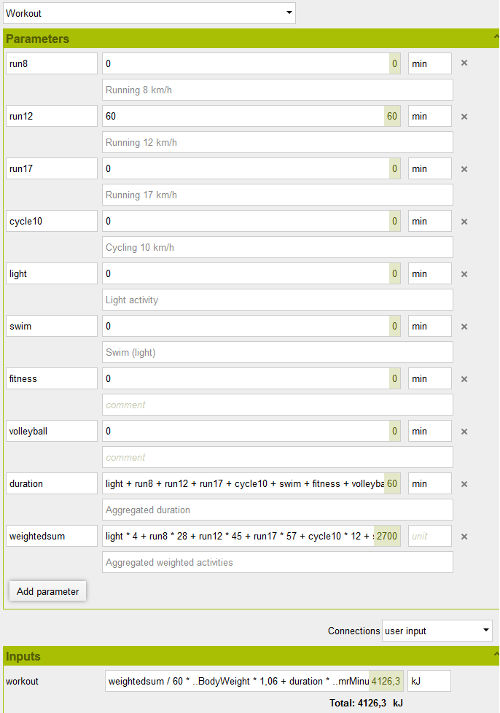
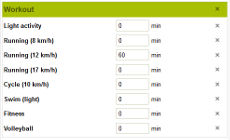
The item "Workout" needs some more parameters:
  1. Close the parameter dialog and open it again for the item "Workout"
  2. Add the parameters with formulas and units (and comments) as specified below "Given data"
  3. Enter the formula from "Given data" for the input "Workout"
  4. Compare the values with the picture below
Now we complete the logic of our diagram with the parameters of the item "Sit or eat"
  1. Close the parameter dialog and open it again for the item "Sit or eat"
  2. Add the parameter "duration" with formula and unit as specified below "Given data"
  3. Enter the formula from "Given data" for the input "sit or eat"
  4. Compare the values with the picture below
In the formula of "duration" we referenced other items with "parameter paths" where item name and parameter name is separated with a dot. (1440 min = 24 h = 1 day)
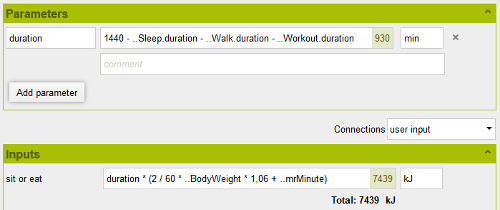
You can test your diagram now or after the next step with the customized data form. - Please be aware, that our mathematical logic produces reasonable results as long as the sum of "durations" does not exceed 1440 min.
Customize the data form
Rearrange fields and access parameter values
Most probably, you did already realize, that the data form of the diagram has changed. It looks somehow complicated now. So, let's simplify it with a better structure.
  1. Select the diagram with a click on the white surface
  2. Open the "Edit form" dialog with a click at the center button below "Data"
  3. Find and scroll to the group "Workout"
  4. Click at a row below "workout" to enter the edit mode.
  5. Currently the captions are equal to the respective parameter names, please change the captions to following values "Light activity", "Running (8 km/h)", "Running (12 km/h)", "Running (17 km/h)", "Cycling (10 km/h)", "Swim (light)", "Fitness" and "Volleyball"
  6. Drag a row with the mouse to another position. - Reorder the rows below "Workout" as you like.
At the moment, there are separate groups for the meals. We want to move these fields in just one group called "Meals".
  1. Find the group "Breakfast" and rename it to "Meals".
  2. Rename the row below from "out: breakfast" to "Breakfast"
  3. Drag the rows for "Lunch", "Snack" and "Dinner" into the group "Meals" and rename the captions
  4. Delete the empty groups "Lunch", "Snack" and "Dinner"
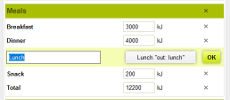
We want to group the activities too:
  1. Find the group "Sleep" and rename it to "Activities"
  2. Rename the caption of "duration" to "Sleep"
  3. Drag the "duration" row from group "Walk" to group "Activities" and give it the proper caption "Walk"
  4. Remove the empty group "Walk"
  5. Click at the "+"-button in the bottom row and "Add value display"
  6. Enter the caption "Sit or eat"
  7. Click at the button right to the caption
  8. Select "duration" from the folder "Sit or eat" and click "OK"
  9. Drag the row between "Sleep" and "Walk"
  10. Finally drag the whole group "Workout" by grabbing it's title panel and drop it into the group "Activities"
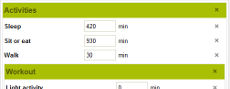
Finally we need a group for the "Personal settings":
  1. Click at the "+" button and "Add group"
  2. Name the new group "Personal settings" and move it to the top
  3. Move the rows "Body weight", "Body height", "Age" and "Sex (0=female, 1=male)" into the group "Personal settings" and give them proper captions.
  4. If necessary, bring the groups "Personal settings", "Meals", "Activities" into this order
  5. Click at the "Save" button.
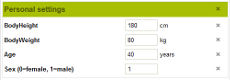
Save value sets as scenarios
Create and activate scenarios
You near to the goal. Let's finish!
  1. Open the "Edit form" dialog again
  2. Click at the "+" buttton and "Add attribute"
  3. Enter the caption "Month" and drag the row to the top
  4. Add another attribute, call it "Day" and drag it below "Month"
  5. Click at the "Save" button
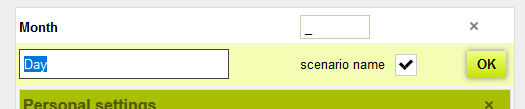
Attributes can serve for two purposes. First, we can reference them in item texts and second, scenarios can be named and structured:
  1. Find the fields "Month" and "Day" in the data form of the diagram.
  2. Enter reasonable values, e.g. "January" and "1"
  3. Select the diagrams title text and enter following text "My calorie balance - {{info.month}} {{info.day}}"
In case that you typed in everything correctly, "{{info.month}}" will be replaced in the diagrams title with "January" (the text, you entered in the field "Month").
Now we are ready to go for our final goal and add scenarios:
  1. Select the diagram with a click at the white surface
  2. Below "Data" click at the rightmost button "Scenarios"
  3. Click at the "+" button and enter "January" and "1" in the respective fields
  4. Click at the folder "January"
  5. Click at the "+"-button again and enter "2"
  6. Add further scenarios if you like
  7. Click at a scenario name to activate it
You can now enter data values for your scenario. - Hint: In the moment you clicked at the "+"-button to create a scenario, the values of the diagram were copied into the scenario. So, if you want your personal settings in every scenario, then enter your personal settings in the diagrams data form (scenarios deactivated) and thenafter create the scenarios.
Congratulations, you did successfully finish the advanced tutorial! - You are now ready to realize your own ideas. Please enjoy Sankey Flow Show!

© 2017-24 THORTEC Software GmbH