| Sankey Flow Show | Attraktive Flussdiagramme in Minutenschnelle |
- APP
- INFOS
- PREISE
- ACCESSOIRES
- ÜBER
Tutorial: My first Sankey Diagram (beginner)
Required license: Test and Student (free)
The example: My calories | |
|---|---|
| Understand the goal of this tutorial. | |
| In this tutorial we want to create a Sankey diagram showing a personal calorie balance for one day. We want to show the share of the particular meals in the total consumption. And we want to show the particular activities with burned calories. And finally we want to see the difference between consumed and burned calories. | Given data: Meals: breakfast 3000kJ, lunch 5000kJ, snack 200kJ, dinner 4000kJ Activities: sleep 2170kJ, sit or eat 7440kJ, walk 494 kJ, workout 4130kJ |
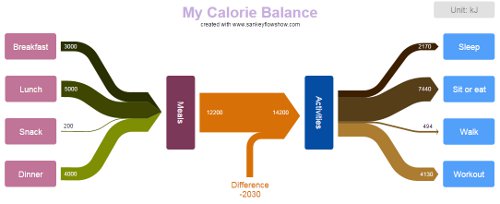 | |
| In the picture above you can see how your diagram will look after this tutorial. Of course you are free to apply your own style and colors. The connections with their arrow heads are showing the direction of the energy flow. | |
| We recommend to walk straight through the tutorial and explore the possibilities of Sankey Flow Show afterwards by modifying details of the complete diagram. | |
Basic terms | |
|---|---|
| Understand the basic concepts. | |
| Just a handful terms at the beginning: Here is an "Item" with it's "Inputs" and "Outputs"... |  |
| ... and a "Connection" with it's "Producer" and it's "Consumer". |  |
| Connection widths are shown proportional to certain amounts. That's the basic idea of a Sankey diagram. | 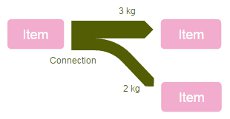 |
| A "Diagram" can contain multiple items and connections. |  |
Preparation | |
|---|---|
| Title, Basic unit, magnetic border, etc. | |
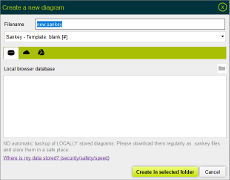
Now, let's start doing! Create a new diagram:
|
 |
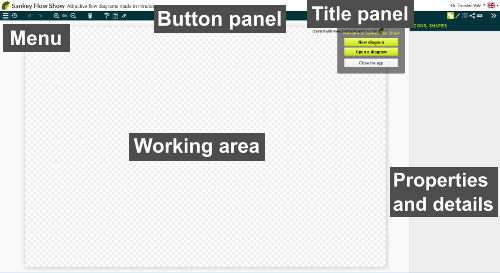 | |
| You created your first Sankey diagram. - Please take a look at the picture above. We will refer to the elements "Menu", "Button panel", "Working area" and "Properties and details" in the following text. | |
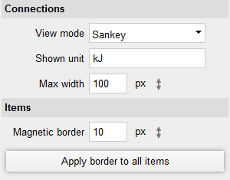
OK, now check the diagram unit and magnetic border settings
|
 |
Start drawing | |
|---|---|
| Create and connect items. | |
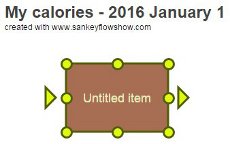
Add the first item to the diagram:
|
 |
Modify the item:
|
 |
As we want to create some items with the same formatting
|
 |
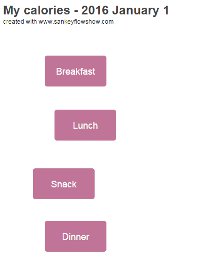
Create some more items:
|
 |
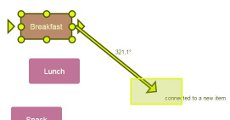
Create your first connection:
|
 |
Format the new item:
|
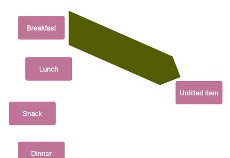 |
| This picture shows how to add curves to a connection by a simple click and drag mechanism. Please apply it in the next step. To remove a curve, just click at the handle of the curve. |
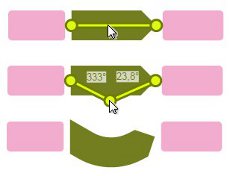 |
Format the connection:
|
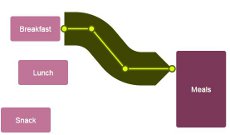 |
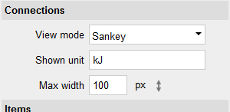
Before we add further connections, we should lower their widths:
|
 |
Add another connection:
|
 |
Add further connections:
|
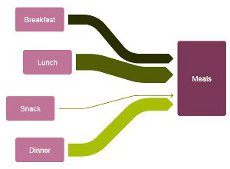 |
Layout the items:
|
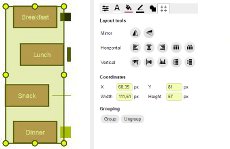 |
Format the item "Meals"
|
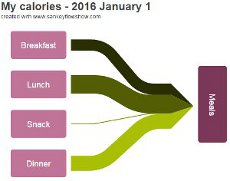 |
Add a title to your diagram:
|
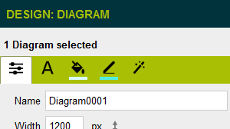 |
Complete the diagram | |
|---|---|
| Apply learnings, connection branch. | |
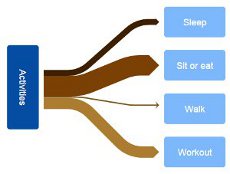
| Well done! You are now ready to create the "Activities" side of our diagram independently. It should look similar to the picture at the right. Please use following values:
|
 |
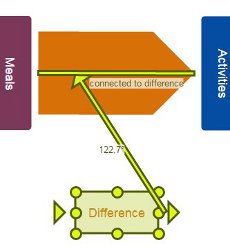
| Add a center connection called "difference" | |
 | |
| |
Branch the "difference" connection
|
 |
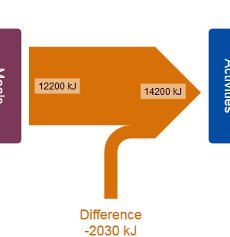
Add indicators to the connection "difference"
|
 |
Finish
| |
Explore the possibilities | |
|---|---|
| Color palettes, view mode, scale connections. | |
| Congratulations: if your diagram looks similar to the one below, you did successfully finish this tutorial! | |
 | |
Now, it is time for you to explore the possibilities of Sankey Flow Show. Play with particular properties and settings! Here are some recommendations for your experiments:
| |