| Sankey Flow Show | Attractive flow diagrams made in minutes |
- APP
- INFO
- PRICING
- ACCESSORIES
- ABOUT
What is a Sankey diagram?
| The Idea | |
|---|---|
| Combine the strengths of flow diagrams and charts. | |
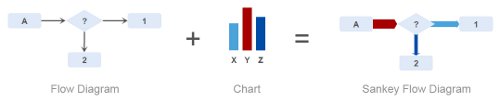 | |
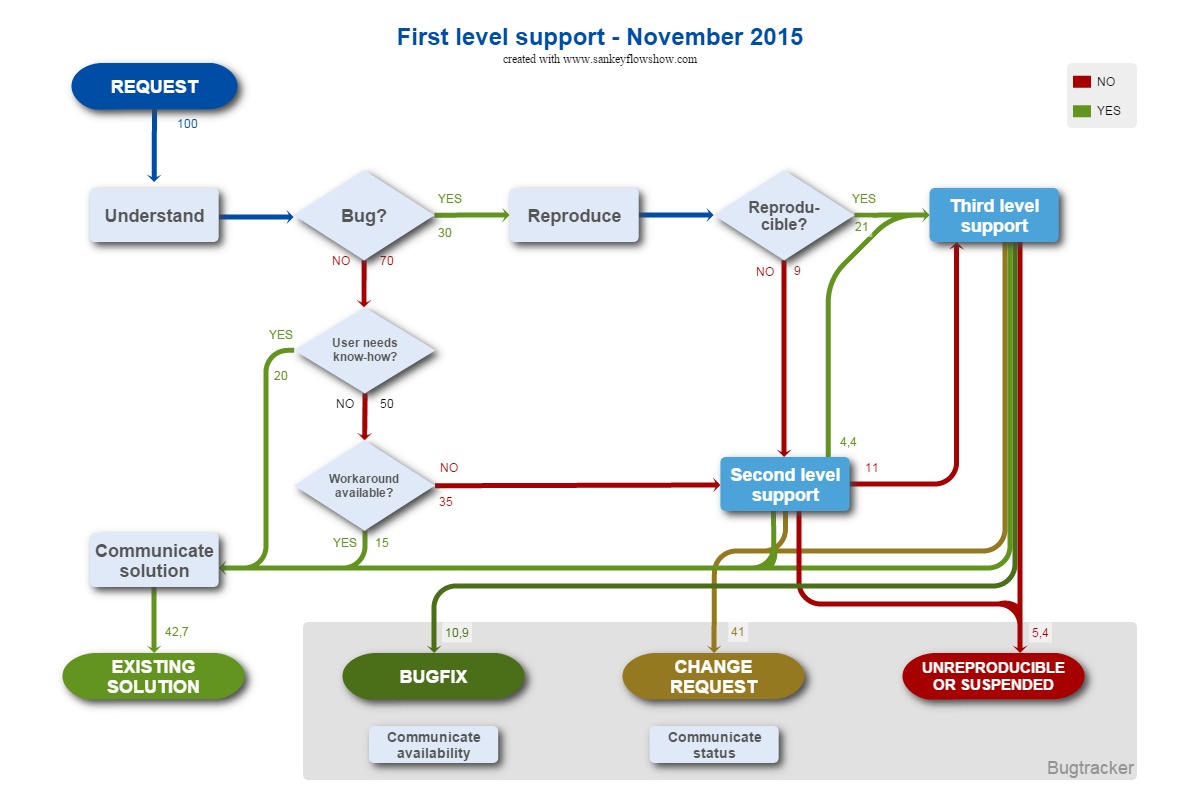
| Work flow diagrams (business organization) and process flow diagrams (engineering) are examples of a classic flow diagram. The next picture shows a classic work flow diagram with constant line strengths. | |
 | |
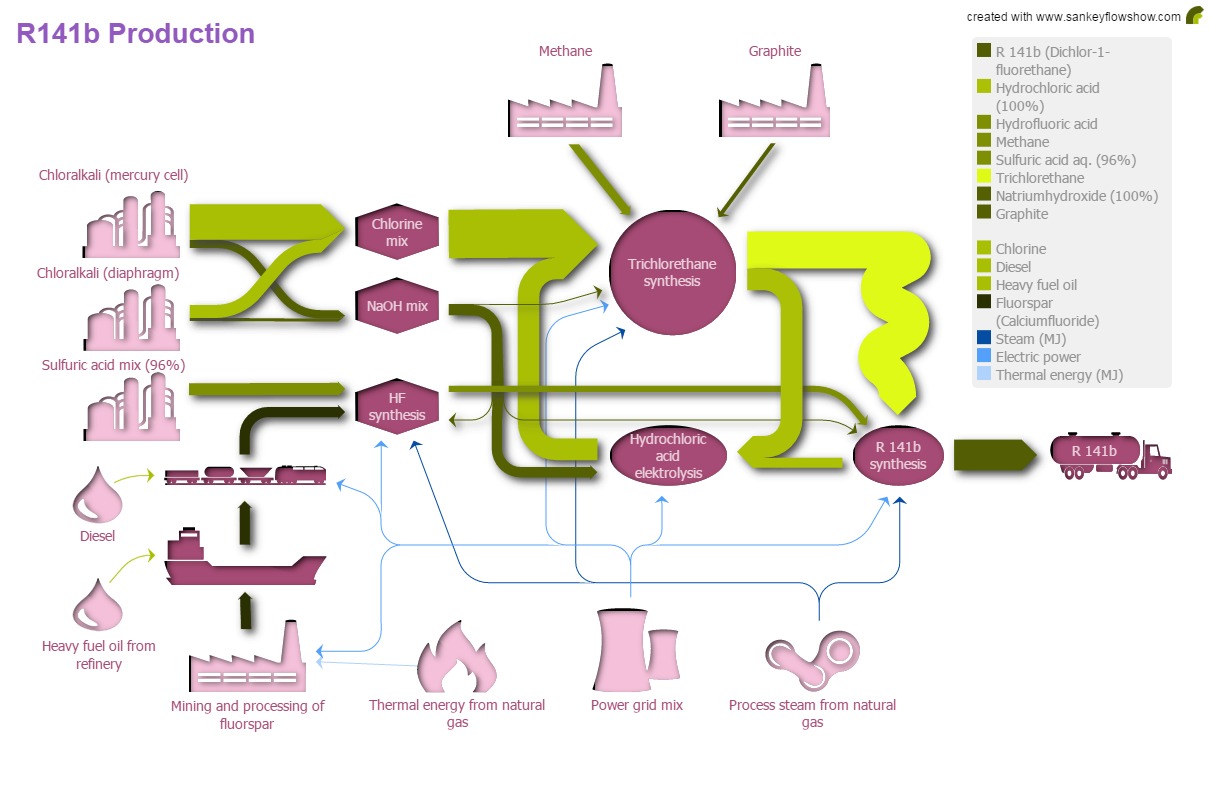
| Flow logic and informations about amounts (e.g. energy, mass, number of cases, etc.) are the basis of a Sankey diagram. The next picture shows the mass flow in a process flow diagram (R141b production). | |
 | |
| The widths of connecting lines are showing amounts in a Sankey diagram. Compare the zoomed details and please note that a trunk sums up the widths of the branches. | 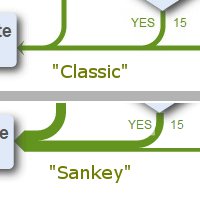 |
| The History |
|---|
| Tribute to Captain Matthew Henry Phineas Riall Sankey. |
[Wikipedia]: "Sankey diagrams are named after Irish Captain Matthew Henry Phineas Riall Sankey, who used this type of diagram in 1898 in a classic figure showing the energy efficiency of a steam engine. While the first charts in black and white were merely used to display one type of flow (e.g. steam), using colors for different types of flows has added more degrees of freedom to Sankey diagrams." The next picture shows Captain Sankeys diagram, redrawn with Sankey Flow Show. |
 |
| Typical use cases for Sankey diagrams are energy flow diagrams and energy efficiency diagrams. - We believe, that the availability of efficient tools will open up the possibilities of Sankey diagrams to a wide range of applications. |
 |
| The Possibilities | |
|---|---|
| Beyond drawing - our vision. | |
The subtitle of Sankey Flow Show was carefully phrased: "Attractive flow diagrams made in minutes!" This subtitle does not only serve for high gloss brochures. It is also summarizes the first two key points of our development and product directives:
| |
 | |
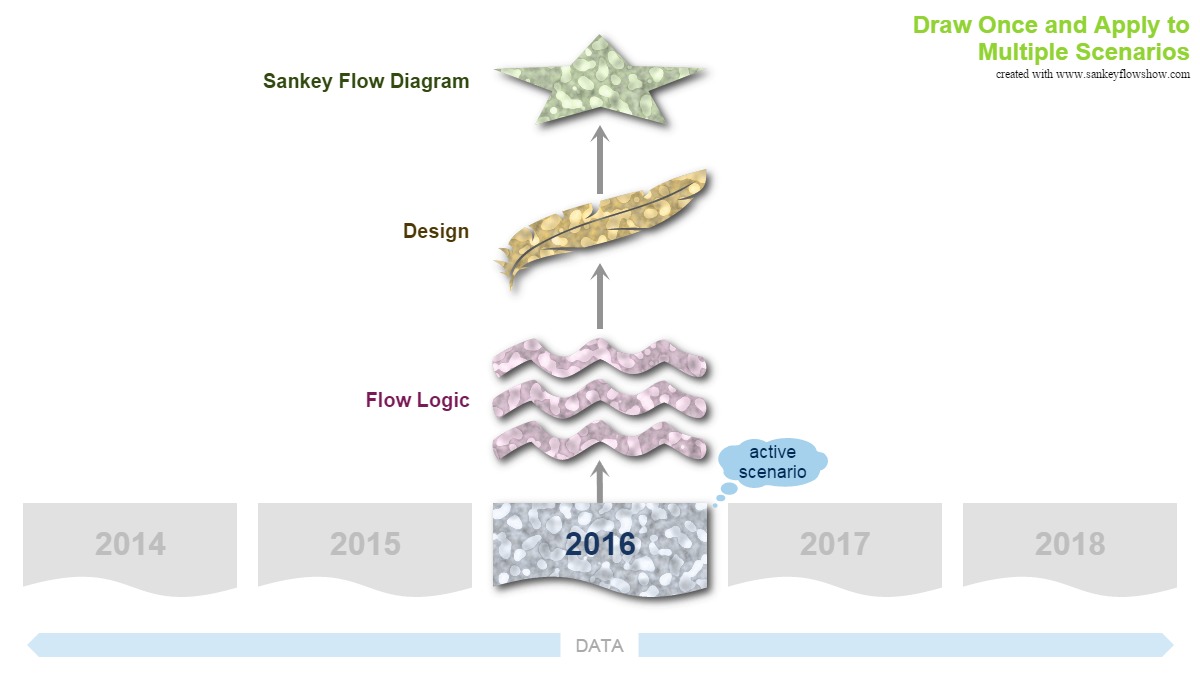
Design your diagrams once and apply them to multiple scenarios! Other than classic flow diagram software, Sankey flow show provides a separate data layer. We believe, that this approach brings high benefits to our users: To produce a diagram for another scenario (e.g. other year, other month, other region, etc.), you just need to enter some numbers instead of executing cumbersome graphical adoptions. | |
 | |
| Test it for free now! | |