| Sankey Flow Show | Attractive flow diagrams made in minutes |
- APP
- INFO
- PRICING
- ACCESSORIES
- ABOUT
Tutorial: Add logic to my first Sankey diagram (intermediate)
Required license: Pro
The extended example: My calories | |
|---|---|
| Understand the goal of this tutorial. | |
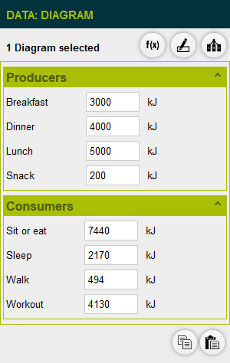
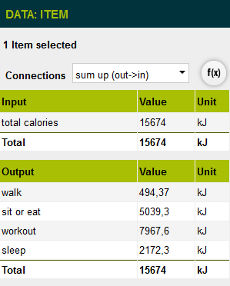
In this tutorial we start with the outcome of beginners tutorial (see picture below). Our first goal is to create a form like the one shown in the picture on the right. The form shows JUST the CHANGEABLE values. And it serves as user interface for value changes. This example requires at least a PRO license, which enables you to add logic to your diagram. |
 |
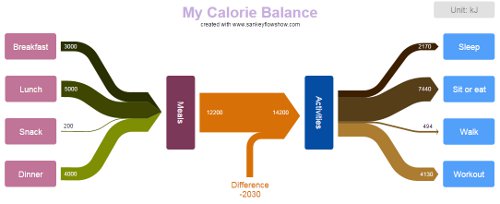 | |
| Our second goal is the automatical calculation of the "difference value". In other words: we want to change e.g. the "workout" value and we want to see the "difference" value adjusting automatically. | |
Preparation | |
|---|---|
| Negative values and arrow heads | |
Can you imagine, how our diagram is looking, when we have a "workout" value of "0"? - In this case, there is a surplus of calories on the "meals" side. The sign of the difference value changes! Now we want to prepare for this situation. First delete the branch to "Difference":
|
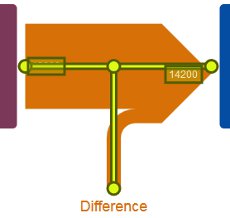 |
There is an inner point left in the connection. Delete it:
| 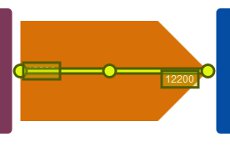 |
Connect "Difference" again (with changed direction):
|
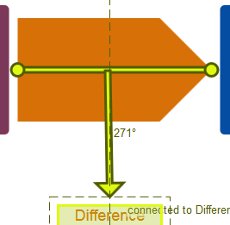 |
| Now, you should see nearly the same picture as the one we had in the beginning. Just the item "Difference" is showing a negative value. Please note, that negative values in connections and their branches change their graphical direction (arrow head). - We will return to this point at the end of the tutorial. | |
Basics: Item types | |
|---|---|
| Understand the basic concepts. | |
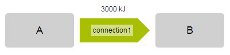
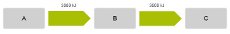
Before we continue modifying our calories example, let's do some basic experiments:
You can create this small example in our calories example and delete it afterwords (or create a new diagram). |
 |
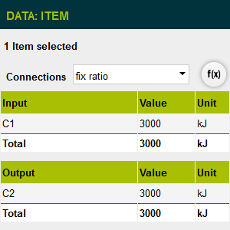
Explore the "Data" properties:
|
|
Tag the item "A" and it's output as changeable:
|
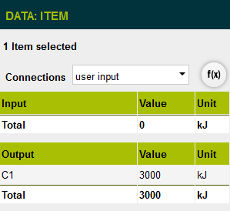 |
See, what has happened to the diagrams data form:
|
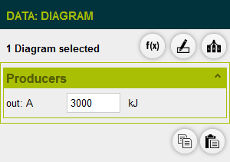 |
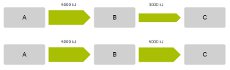
Extend the example to a chain:
|
 |
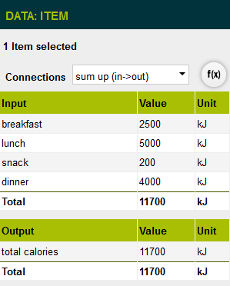
Add logic to item "B":
|
 |
Now, see what happens, if you change the output value of "A":
|
 |
| If you created this example in the calories diagram, please delete this example now. | |
Complete the calories example | |
|---|---|
| Set item types. | |
Select the changeable values:
|
|
Add logic to the item "Meals":
|
 |
Add logic to the item "Activities":
|  |
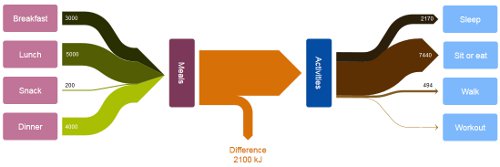 | |
| Congratulations, you did successfully finish this tutorial. You can now change e.g. the value of "Workout" to "0" in the diagrams data form. Your diagram will then look similar to the one above. Please note, that the connection "Difference" adjusts automatically and depending on your values, the DIRECTION of the branch to "Difference" changes too. | |